Lower absence costs
In euros, not dashboards. You see what each change is worth.
Personalised • 2 minutes • Instant results
From the market
Figures from TNO Arbobalans 2024 (NEA/ZEA) and independent market research.
Problem & cost
Irregular shifts disrupt sleep and recovery. The signals appear months earlier, but scattered across systems:
Reacting after the fact, to dropout you didn't see coming.
Signalling months earlier and adjusting via the roster.
Ten years of TNO's NEA/ZEA figures all point one way, and those are exactly the signals ShiftRecovery brings together early.
8 findings, fully sourced. TNO Arbobalans 2024 (NEA/ZEA, 2015-2023).
What we solve
Behind every absence figure is someone who pushed on too long. We make that visible before it goes wrong, so you can adjust in time.


In euros, not dashboards. You see what each change is worth.
You see risk build months earlier, well before the sick note.
Which change lowers team risk, concretely and with the reasons.
How it works
We combine the three factors that matter most in shift work, grounded in established sleep and fatigue science.
What managers see
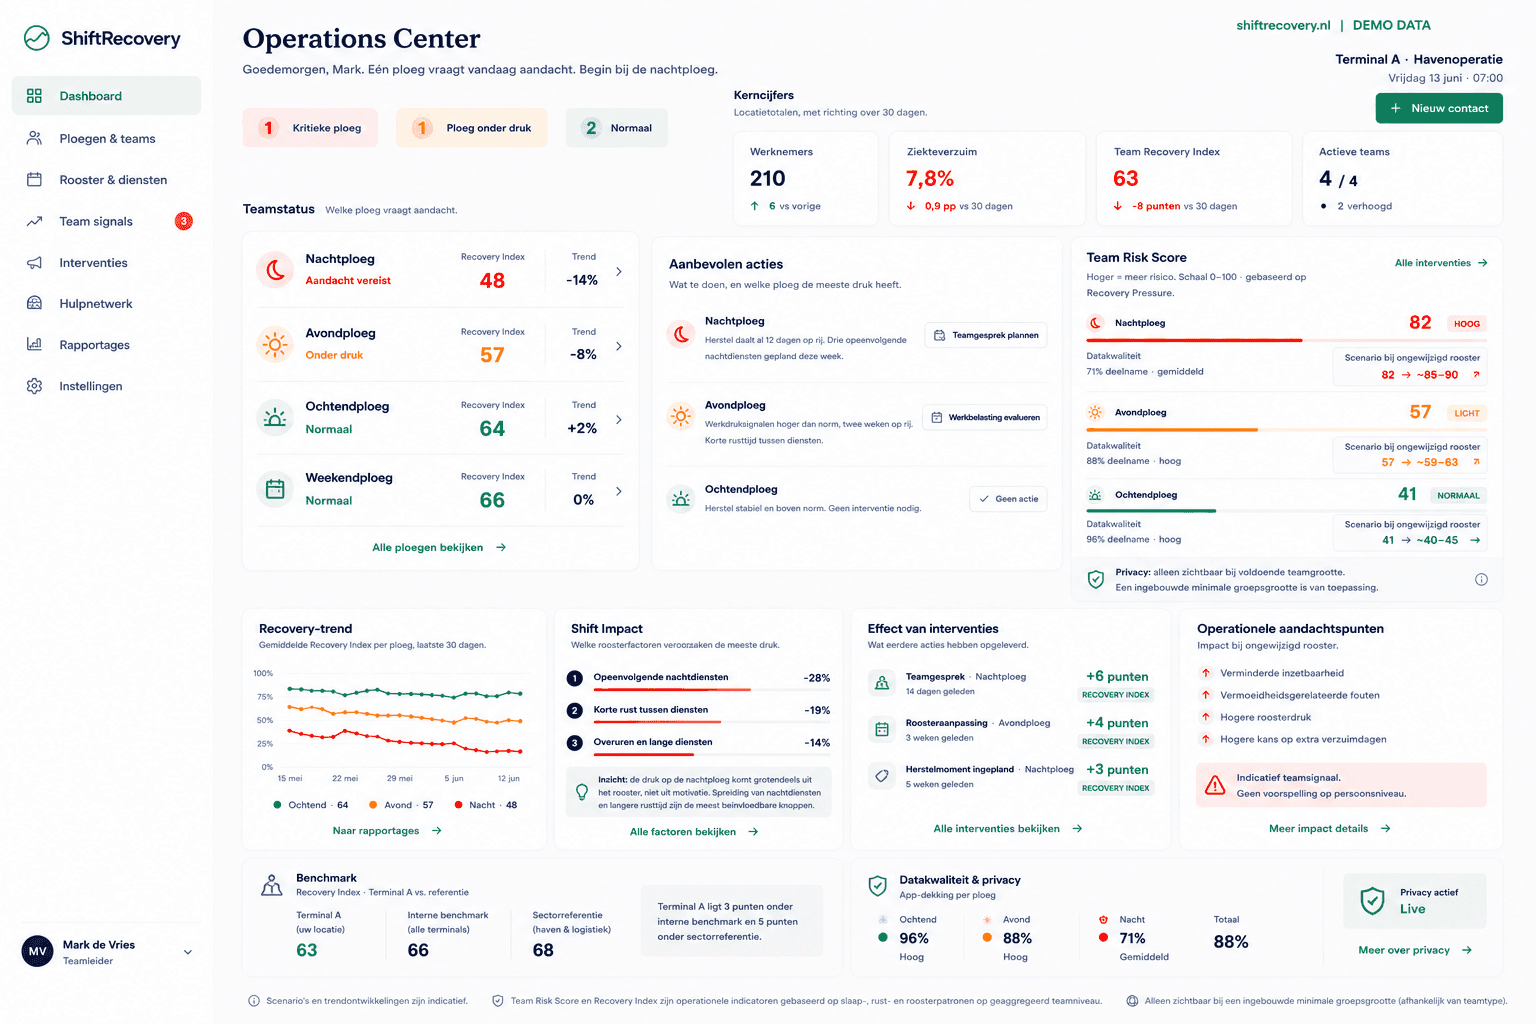
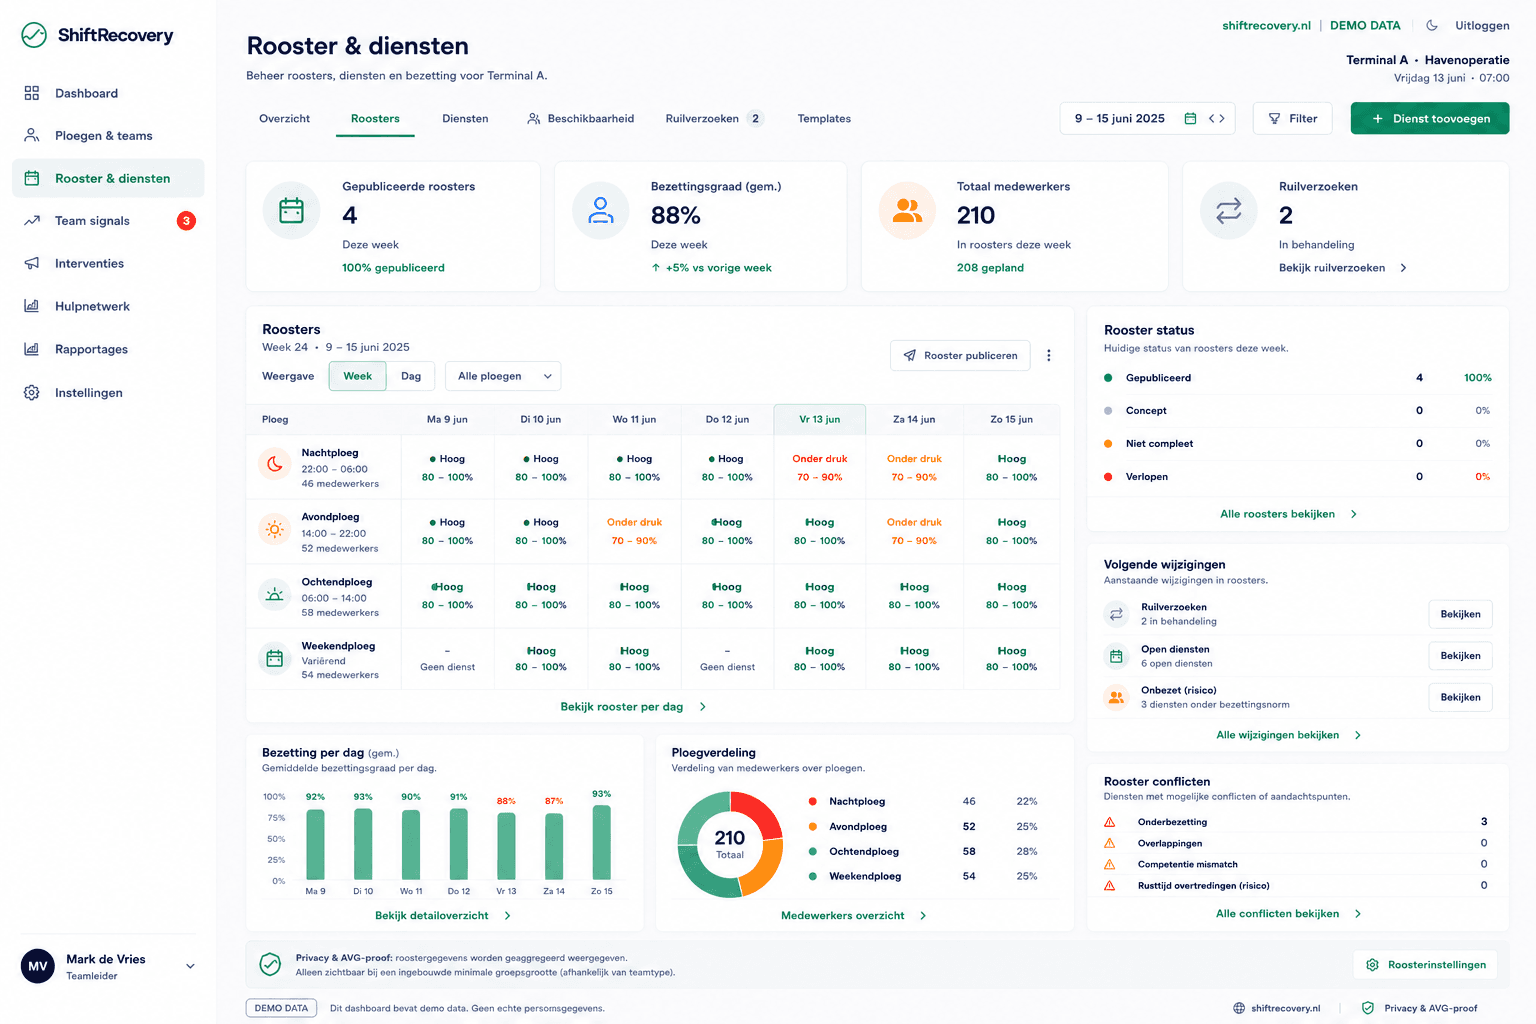
See at a glance which shift needs attention today, with a Team Risk Score per team and the expected absence in both days and euros.
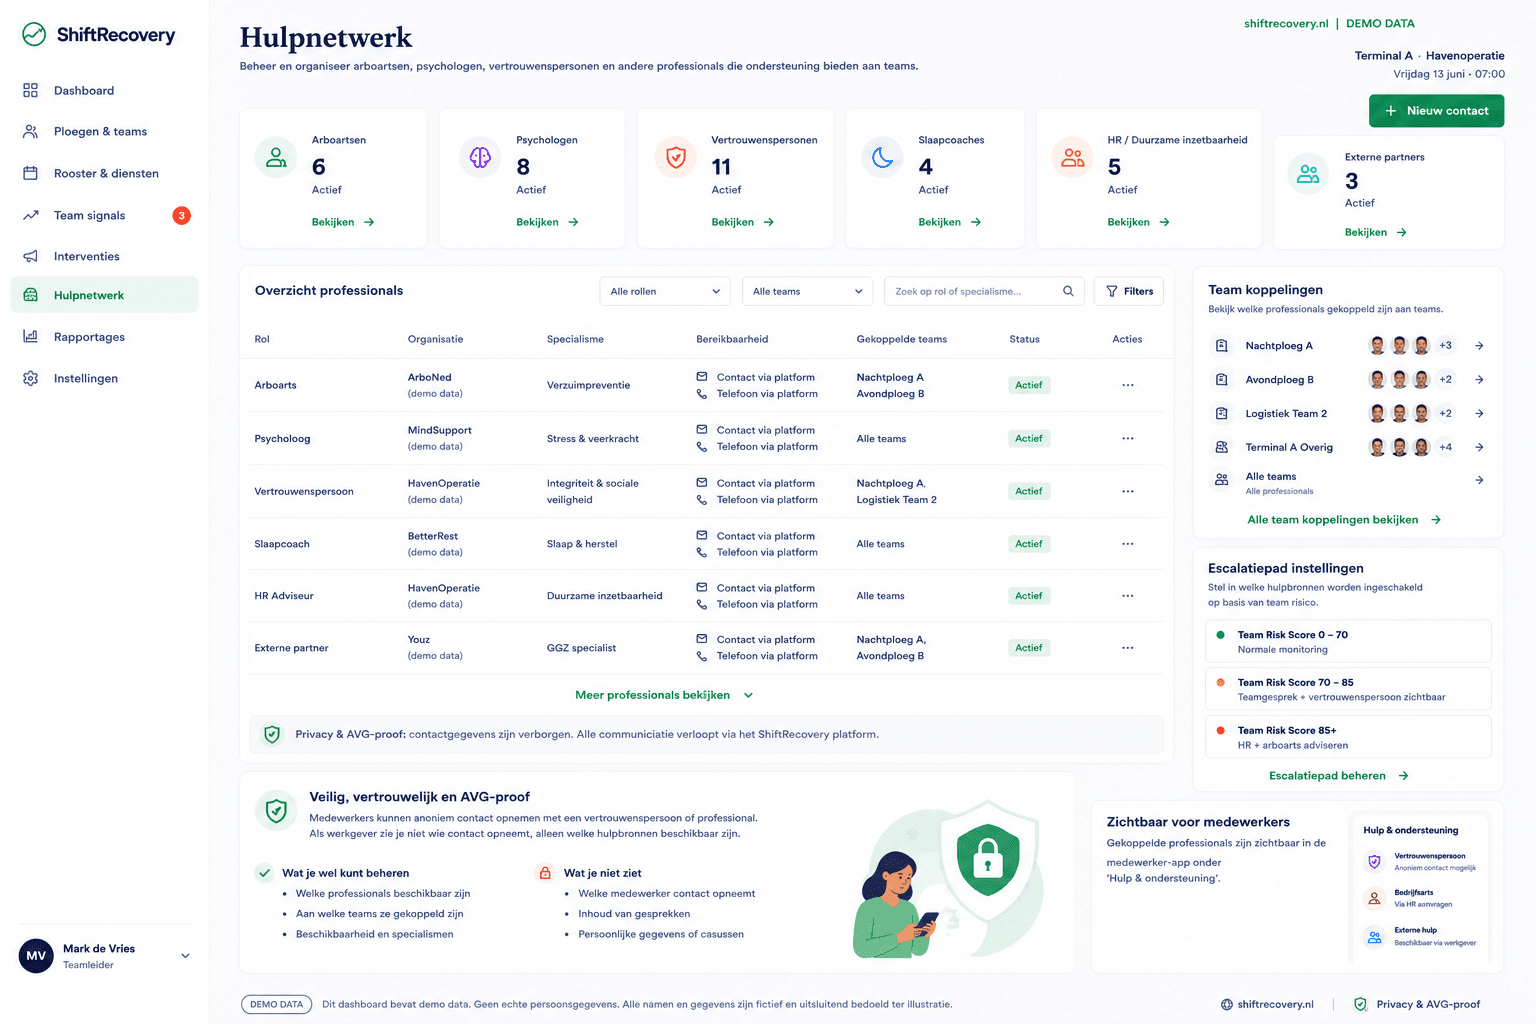
Privacy guaranteed, only aggregated team data.

Our promise
We build ShiftRecovery so no one quietly burns out and no manager is caught off guard. People first; the numbers follow.
Privacy
Without trust no honest data, and without honest data no reliable signal. That's why the aggregation boundary is built in.

FAQ
That's exactly the baseline. But a collective labour agreement defines what's allowed, not what's optimal for recovery. Almost every shift-work organisation in the Netherlands is compliant and still sees structural absence, fatigue and dropout. We don't replace the agreement; we help organisations make better choices within its limits.
Because that's where the longest and most expensive absence sits. Psychological absence lasts 63 working days on average, over 21× longer than the flu. And structural shift work raises absence odds by 1.15×, even after correcting for every other work, company and personal characteristic. Those are exactly the signals we bring together early. (TNO Arbobalans 2024)
We completely understand. That's why the employer never sees individual health data. The dashboard works only at aggregated team level. Individual data stays with the employee, in a separated environment that neither the employer nor ShiftRecovery itself can access.
Preventing a single long-term absence often already recovers the investment. Consider: in 2023 employers paid €20 billion in wage continuation for absence, €4.9 billion of it driven by psychosocial workload, and psychological absence lasts 63 working days on average (TNO Arbobalans 2024). The business case isn't in the software; it's in the costs you avoid.
Pilot
No implementation project. No org-wide rollout. Start with one team and see within weeks where risk is building.
Together we pick one shift to start with.
We show the risk picture based on your rosters and data.
Does it work? Then we expand. If not, it stops here.